Graphing server metrics from the command line – sarplot
Here’s a useful tool me and colleague wrote a few years ago to graph system resource metrics (think: load, cpu, memory, swap, io, etc) on the command line:
https://github.com/hcooper/sarplot
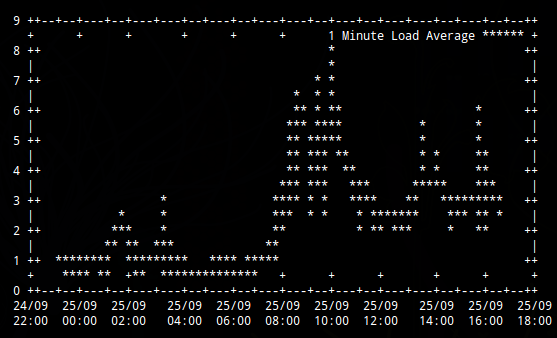
It only has two dependancies: sar (provided by the sysstat package), and gnuplot. Here’s an example graphing the last 24 hour’s load on a busy database box:
Read other posts